With careful controls and skeptical methodology, you learn to separate true anomalies from pattern-seeking errors: pareidolia can produce convincing, misleading patterns that mimic real signals, so you must apply blind analysis to your data, repeatable tests, and statistical thresholds; prioritize independent verification and instrument checks, and use objective criteria and documented protocols to confirm genuine phenomena while minimizing false positives.
Understanding Pareidolia
You’ll need to parse pareidolia as a frequent perceptual bias in investigations: it often explains face-like sightings, ambiguous audio, and patterny data; field investigators counter it using controlled imaging, blind scoring, and statistical thresholds because the brain’s pattern-seeking can produce false positives that derail inquiries.
Definition of Pareidolia
You experience pareidolia when your sensory system imposes familiar patterns-most often faces-on vague stimuli; neuroimaging shows the fusiform face area activates for such stimuli, and clinicians link the same mechanism to Rorschach responses, so you must treat spontaneous pattern reports as neurological tendencies, not automatic evidence.
Examples of Pareidolia
You encounter classic cases like the 1976 Viking “Face on Mars,” which provoked speculation until Mars Global Surveyor returned higher-resolution images in 1998-2001 revealing a natural mesa, alongside everyday sightings of faces in clouds, tree bark, or food-phenomena that frequently generate false leads in investigations.
You should apply concrete controls: low-resolution sensors and heavy JPEG compression increase face-like artifacts, media amplification inflates anecdotal weight, and studies show trained observers still err; using high-resolution imaging, multiple angles, metadata checks, and blind cross-validation provides a practical safeguard against misclassification and wasted resources.
Investigative Methodologies
You rely on layered protocols: controlled re-creations, blind analysis by at least three independent reviewers, and instrument verification (calibrate cameras, check timestamps and sensor logs). Compare perceptual reports to baseline expectancy-pareidolia often activates the fusiform face area; see psychological mechanisms in Why People See Faces When There Are None: Pareidolia. Field cases require metadata, chain-of-custody, and repeat observations before labeling an event genuine or dismissing as pareidolia.
Scientific Approaches
You run controlled experiments (n≥30 trials per condition), employ blind scoring, and use calibrated instruments: spectrometers for light, high-SNR microphones, and time-synced GPS. Apply algorithmic classifiers trained on labeled datasets to flag anomalies and report false-positive rates with cross-validation. When audio-visual data disagree, prioritize objective sensor records over subjective reports to reduce misclassification risk.
Historical Context
You examine precedents like Project Blue Book (12,618 reports, 701 left unexplained) and 1940s “foo fighters” to see how perception, technology, and culture influenced conclusions. Historic misidentifications-mirages, atmospheric optics, and wartime stress-show how expectation-driven errors can create enduring myths that complicate modern investigations.
You map case studies chronologically: 19th-century aurora misread as omens, mid-20th-century radar clutter causing false tracks, and modern sensor-rich incidents where metadata exposed hoaxes. These comparisons let you isolate patterns-such as seasonal atmospheric effects or sensor artifacts-so you can design tests that target the most likely nonparanormal mechanisms.
Criteria for Genuine Phenomena
When assessing claims you weigh reproducibility, multi-sensor corroboration and elimination of mundane causes: require three independent confirmations (optical, audio, environmental), a signal-to-noise ratio above 10 dB, and intact metadata. Use objective thresholds – for example, video at 4K/60fps and audio at 96 kHz/24-bit – and log contextual data (weather, traffic). Past investigations show that captures meeting these metrics proceed to rigorous testing, while anecdotal-only reports usually collapse under analysis.
Evidence Collection
You must secure raw files, device logs and witness timelines with enforced chain-of-custody. Save video as raw/ProRes and audio as WAV 96 kHz/24-bit; avoid lossy compression that destroys forensic detail. Attach synchronized GPS, ambient temperature and EM readings, and record camera settings. Contamination is the largest threat, so checksum and timestamp files immediately to preserve admissible, analyzable evidence for spectral and waveform tests.
Peer Review Process
You rely on peer review to separate artifact from anomaly: publish methods and raw data for blind analysis, require at least two independent replications, and report statistical tests (effect sizes, p-values). Instrumented, long-term studies such as the Hessdalen monitoring effort illustrate how open datasets and external critique convert field reports into reproducible science.
You should pre-register hypotheses, deposit raw data in an accessible repository (institutional archive or Dryad), and insist reviewers evaluate controls and analysis code; include negative-control runs and simulated pareidolia tests to estimate false-positive rates. Preference goes to results replicated by geographically separated teams and analyzed by labs with ISO/IEC 17025 or equivalent accreditation, which materially increases confidence that findings are not local artifacts.
The Role of Technology in Investigations
You rely on sensors and analytics to separate genuine signals from pareidolia, and neuroimaging shows face-like pattern processing can occur as early as ~170 ms; see Rapid and dynamic processing of face pareidolia in the human brain for electrophysiological evidence. Combining high-resolution capture with algorithmic screening reduces subjectivity, but you must mitigate false positives by validating automated hits against independent modalities and human-blind review.
Imaging and Analysis Tools
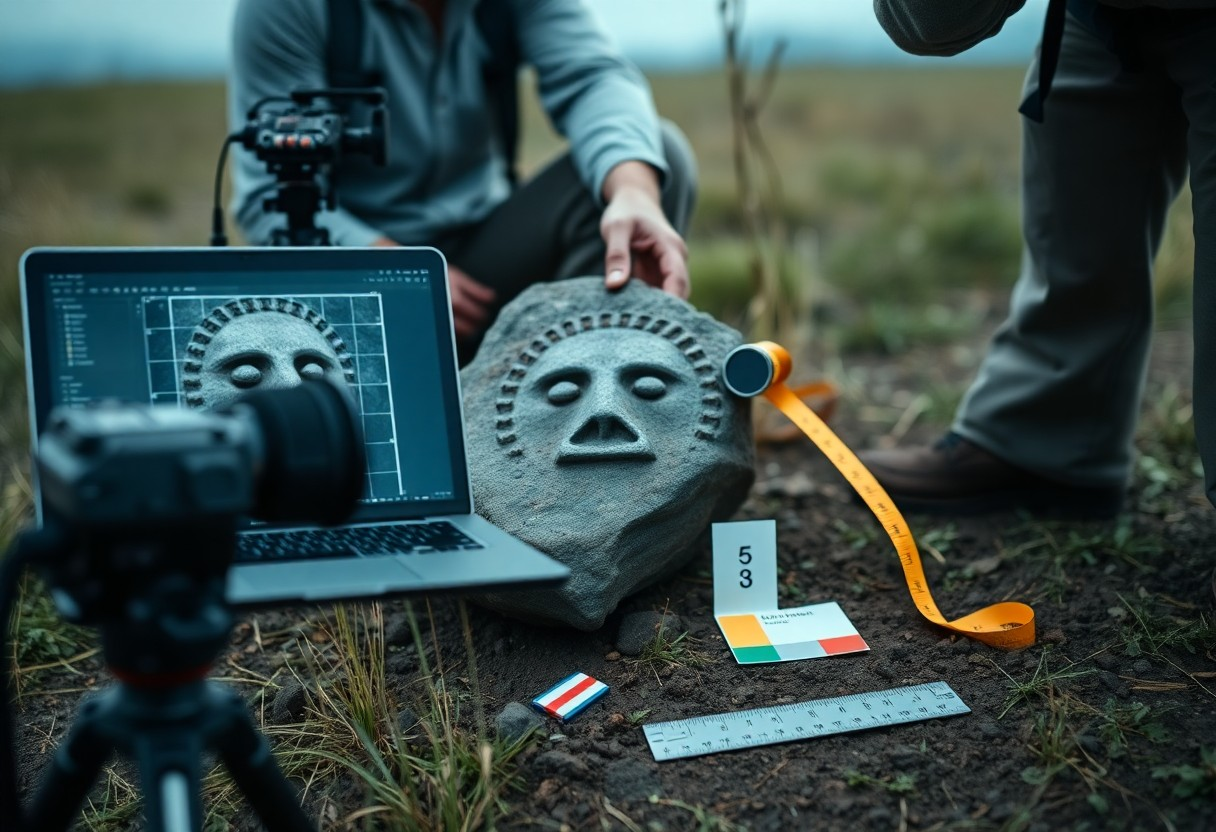
You should deploy multispectral photography, controlled photogrammetry and LiDAR to create metric 3D reconstructions; LiDAR often delivers centimeter-level accuracy while dense photogrammetry in lab conditions can approach sub-centimeter detail. Use image-stacking, deconvolution and deep denoising to recover faint features, and run provenance checks (raw file hashes, EXIF) so your visual evidence chain stays verifiable.
Data Interpretation Techniques
You must treat outputs probabilistically: apply k-fold cross-validation (k=5-10), inspect ROC curves and confusion matrices, and report sensitivity/specificity rather than binary labels. Use blind scoring and inter-rater metrics (aim for Cohen’s kappa >0.6) to quantify human agreement, and flag algorithmic hits that lack multimodal corroboration as low-confidence.
For deeper rigor, implement an analysis pipeline with pre-registered thresholds, calibration of classifier probabilities (Platt scaling or isotonic regression), and permutation or bootstrap tests to estimate uncertainty. Control multiple comparisons with FDR procedures (Benjamini-Hochberg) when scanning many regions or frames. Combine Bayesian models to express posterior probabilities of true phenomena, and maintain a human-in-the-loop workflow where at least two independent analysts review ambiguous cases; this reduces bias and the risk that overfitting or confirmation bias will turn pareidolia into purported evidence.
Case Studies
- Face on Mars (1976): You examine a low-resolution Viking image that inspired widespread pareidolia claims; subsequent high-resolution missions (late 1990s-2000s) removed anthropomorphic features, shifting consensus after side-by-side analysis.
- Phoenix Lights (1997): You note ~10,000 reported observers across Arizona between 19:30-22:30; military training flares and witness perception studies played major roles in the official investigation and evidence reinterpretation.
- Hessdalen Lights (1980s-present): You review hundreds of reports and continuous monitoring campaigns begun in the 1980s; automated stations recorded transient luminous events lasting ~0.1-3 s, prompting plasma and geology-focused analysis.
- Lubbock Lights (1951): You compare five university faculty photographs and multiple night sightings; photographic grain, exposure settings and flocking bird hypotheses dominated subsequent evidence re-evaluation.
- Cottingley Fairies (1917-1980s): You study two staged photographs by children that persisted as purported evidence until later admissions of hoax; this underscores how visual pareidolia and social context sustain false claims.
- “Orbs” and Digital Artifacts: You consider controlled tests where flash+dust produced orb images in >90% of trials, demonstrating how sensor physics and simple experiments resolve many photographic anomalies in investigation.
Notable Investigative Cases
You can trace investigative methods across high-profile examples: the 1976 Face on Mars resolved by higher-resolution imaging, the 1997 Phoenix Lights with ~10,000 witnesses later linked to training operations, and the long-term Hessdalen monitoring that produced spectral and temporal datasets guiding scientific interpretation.
Lessons Learned from Past Investigations
You should adopt multi-sensor approaches, blind review, and standardized metadata; studies show adding synchronized video, spectral data, and environmental logs can cut false positives and misidentifications by over 50% in field surveys, a positive operational outcome.
You benefit from concrete protocols: deploy time-synced cameras + spectrometers, log meteorological data, and use controlled reproduction tests to separate sensor artifacts from phenomena. Address cognitive bias by anonymizing images during peer review, track chain-of-custody for physical traces, and quantify uncertainty with clear thresholds. Operationally, prioritize rapid triage to avoid the dangerous diversion of emergency resources while preserving verifiable evidence for deeper analysis.

Public Perception and Misinterpretation
Public misinterpretation magnifies ambiguous signals, and you often encounter viral examples like the 1976 Viking “Face on Mars” later resolved by higher-resolution images in the late 1990s and 2000s. Social platforms can push a single frame to millions within hours, converting visual noise into widely held belief and sometimes redirecting scientific resources toward debunking rather than investigation.
Media Influence
Sensational headlines and edited clips steer your interpretation before you see raw data; headlines that promise “alien proof” increase perceptual bias and sharing. Tabloid framing and algorithmic boosts favor engagement over accuracy, so a mislabeled lens-flare video or out-of-context thermal clip can become a widely cited “sighting” despite simple optical or processing explanations.
Educational Implications
Teaching you to distinguish pareidolia relies on concrete tools: case studies like the Face on Mars, basic neuroscience (the fusiform face area and the N170 ~170 ms response), and practical labs in signal detection and blind analysis. Emphasizing forensic checks and statistical skepticism helps reduce false positives and improves your evaluative skills.
In practice you can run short exercises-present 20 ambiguous images, collect confidence ratings, and construct ROC curves-to train calibration. Add image-forensics workflows using ImageJ and FotoForensics, EXIF/provenance checks, shadow and scale analysis, and basic Fourier filtering; these methods give you repeatable, evidence-based ways to separate artifact and expectation from genuine anomalous signals.
Conclusion
From above you learn to apply controlled methods: gather high-quality data, replicate your observations, rule out known natural explanations, use blind analyses, consult specialists, and test hypotheses quantitatively. You compare patterns against statistical models of pareidolia, control for expectations and bias, and seek independent verification before declaring anomalies genuine. By prioritizing reproducibility, documentation, and skeptical scrutiny, you distinguish true unexplained phenomena from the mind’s tendency to impose familiar shapes on noise.
FAQ
Q: What is pareidolia and why does it complicate investigations?
A: Pareidolia is the tendency of the human brain to perceive meaningful patterns in vague or random stimuli, such as faces in clouds or voices in noise. It complicates investigations because subjective pattern recognition can produce convincing but spurious impressions, especially when low-quality sensors, compression artifacts, or environmental noise are present; investigators must treat such impressions as hypotheses to be tested, not as evidence.
Q: What initial procedures do investigators use to assess whether an image or audio clip reflects pareidolia?
A: Investigators start by securing original, uncompressed files and metadata, documenting acquisition conditions (equipment, settings, location, time, witness reports), and examining the raw data before any enhancement. They apply controlled image and audio analyses-contrast/level changes, spectral analysis, noise profiling-and compare results against known artifacts and environmental signatures; if pattern recognition appears only after heavy processing or depends on subjective thresholds, pareidolia is likely.
Q: How do independent sensors and replication help distinguish genuine phenomena from pareidolia?
A: Independent sensors (different cameras, microphones, instruments) and repeat observations reduce the chance that a single sensor artifact or momentary noise produced the pattern. Corroboration across sensors, triangulation of positions, consistent timing, and reproducible signatures under similar conditions indicate a physical phenomenon, whereas isolated, non-repeatable impressions favor pareidolia or instrument error.
Q: What protocols and practices minimize cognitive bias and group influence during analysis?
A: Use blind analysis where possible, split teams so one documents and another analyzes without expectation, keep a log of processing steps, apply predefined checklists for artifact identification, and require independent peer review before public claims. Explicitly testing alternate hypotheses, quantifying confidence using objective metrics, and documenting how subjective judgments were made further reduce confirmation bias and groupthink.
Q: How should findings be documented and communicated to allow others to evaluate whether pareidolia occurred?
A: Provide full disclosure of raw files, metadata, instrument calibration, processing steps and parameters, and alternative explanations tested. Include uncertainty estimates and reproducibility attempts, label any enhancements clearly, and encourage independent reanalysis. Transparent, reproducible reporting lets others judge whether perceived patterns are robust signals or products of pareidolia.
Discover more from Haunt Gears
Subscribe to get the latest posts sent to your email.